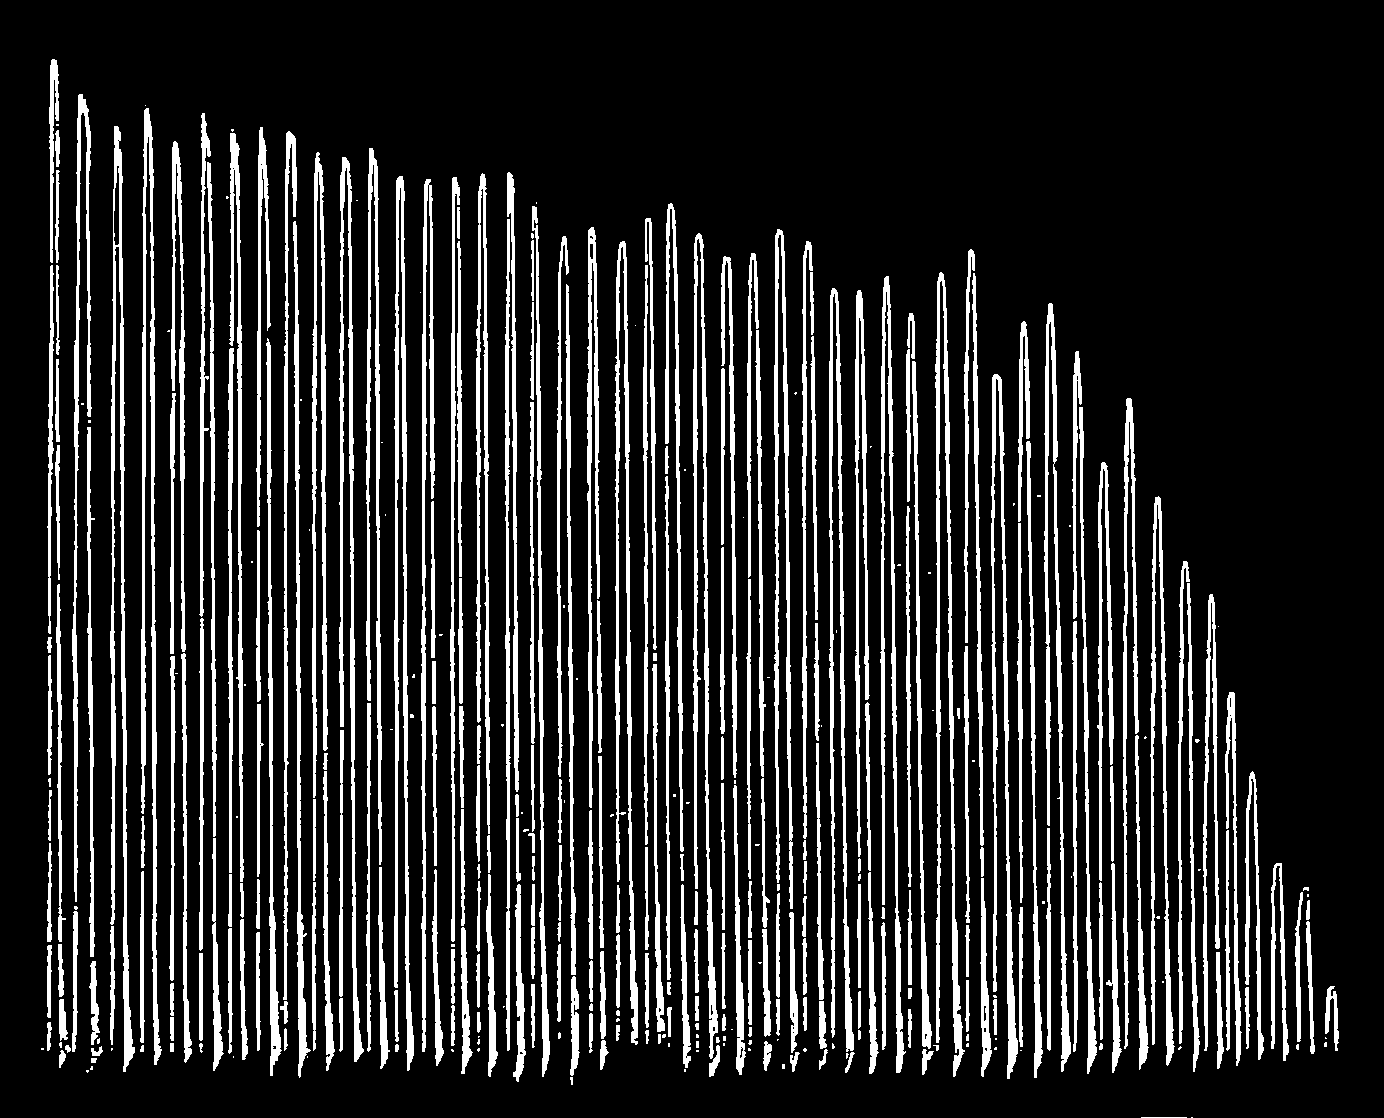
The image shows a black and white line graph depicting the number of people who have died in a plane crash.
Read full description
The image shows a black and white line graph depicting the number of people who have died in a plane crash. The graph is composed of a series of lines that represent the frequency of the crash, with the highest frequency at the top and the lowest at the bottom. The lines are arranged in a radial pattern, with each line representing a different frequency. The colors of the lines vary, with some being shades of blue, green, and yellow, while others are shades of red, orange, and purple. The background of the graph is a solid black color.