Read full description
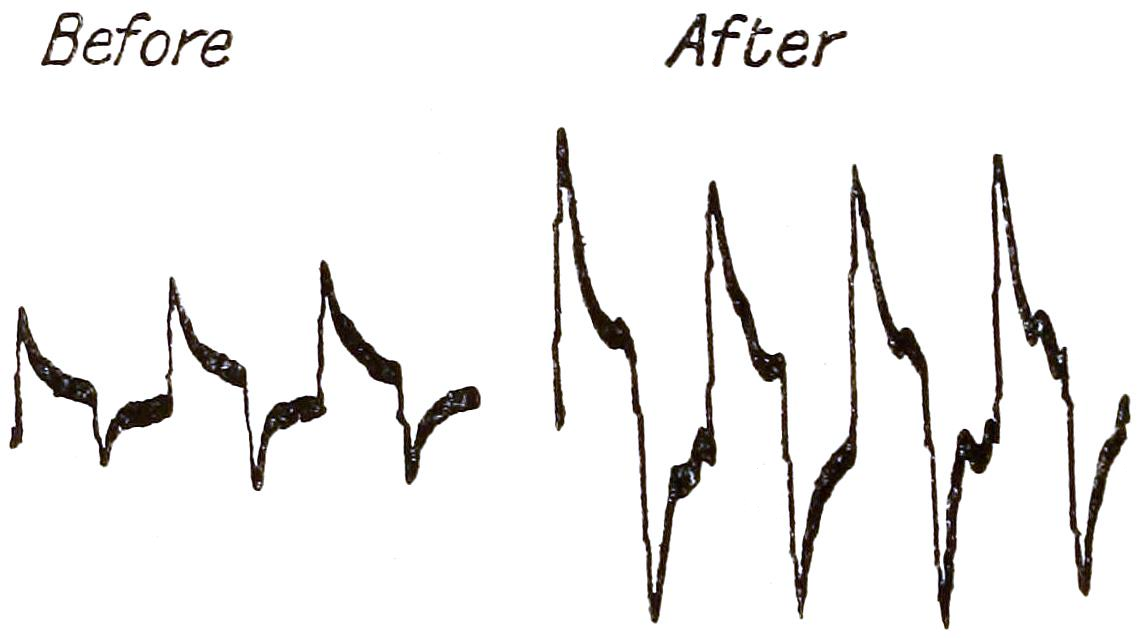
The image shows a black and white photo of a heartbeat line with the words "before" and "after" written on it, indicating that it is a representation of the results of an electrocardiogram. The graph is composed of a series of lines that represent the frequency of the heartbeat, with the x-axis representing the time period and the y-axis indicating the frequency. The lines are black in color and the text is written in a bold font, making it stand out against the white background.