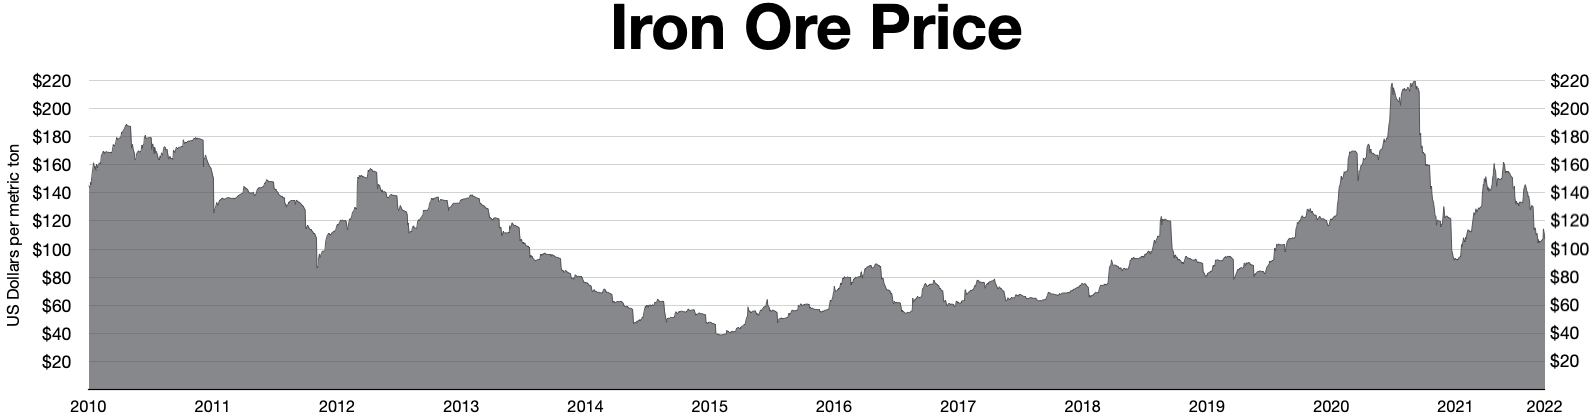
The image shows a graph of the iron ore price, with the text "iron ore price chart" at the top.
Read full description
The image shows a graph of the iron ore price, with the text "iron ore price chart" at the top. The graph is composed of a series of bars, each representing a different year, with a height of approximately 1.5 inches. The bars are labeled with the corresponding year, and the height of the bars indicates the price of each year. The colors used in the graph are mostly shades of blue, green, and yellow, with some hints of red and orange.