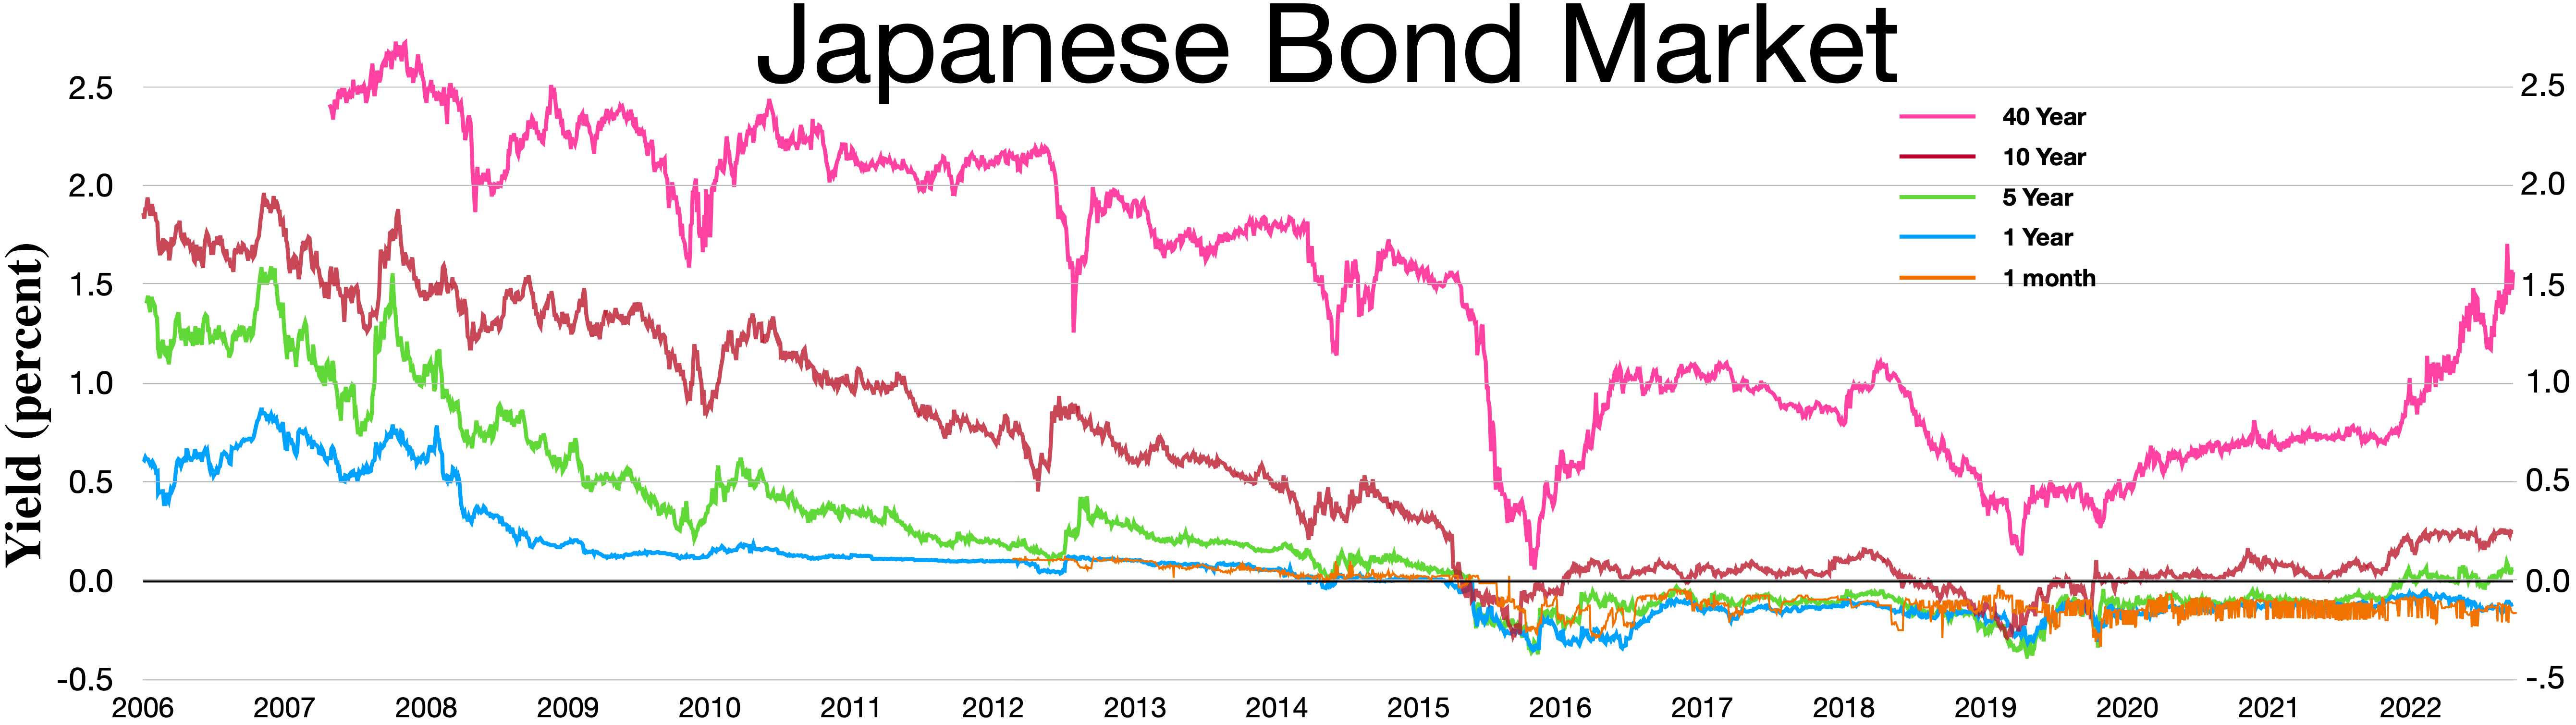
The image shows a graph of the Japanese bond market, with different colors representing the different levels of the market.
Read full description
The image shows a graph of the Japanese bond market, with different colors representing the different levels of the market. The graph is accompanied by text that provides further information about the market, such as the type of bond, the duration of the bond, and the interest rate.