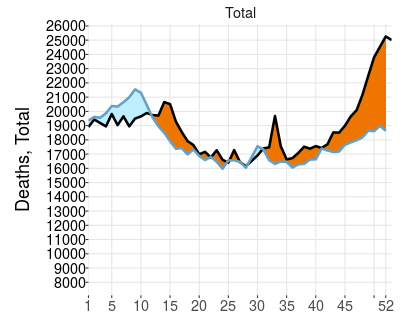
The image shows a graph depicting the number of deaths in the United States.
Read full description
The image shows a graph depicting the number of deaths in the United States. The graph is divided into two sections, one in blue and one in orange, and each section is further divided into numbers. The blue section is labeled "Deaths" and the orange section is labelled "Total". The graph shows a steady increase in deaths over time.