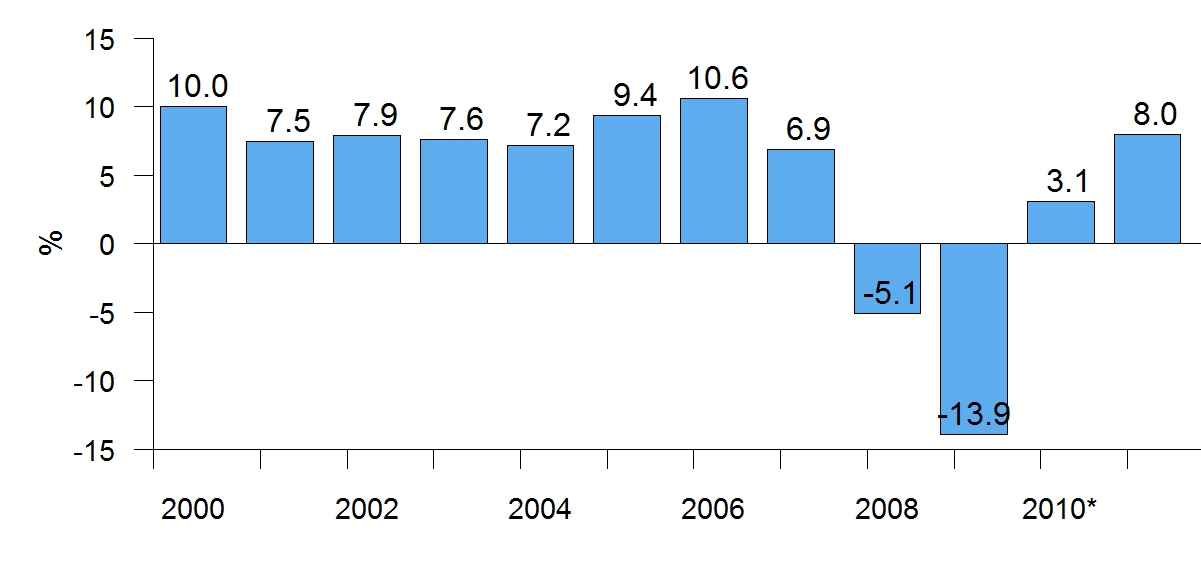
The image shows a bar chart depicting the number of people who have been diagnosed with cancer in the United States.
Read full description
The image shows a bar chart depicting the number of people who have been diagnosed with cancer in the United States. The chart is composed of a series of bars, each representing a different year, with the height of each bar indicating the percentage of people diagnosed with the disease. The bars are labeled with the years from 2000 to 2010, and the y-axis of the chart is labeled with numerical values.