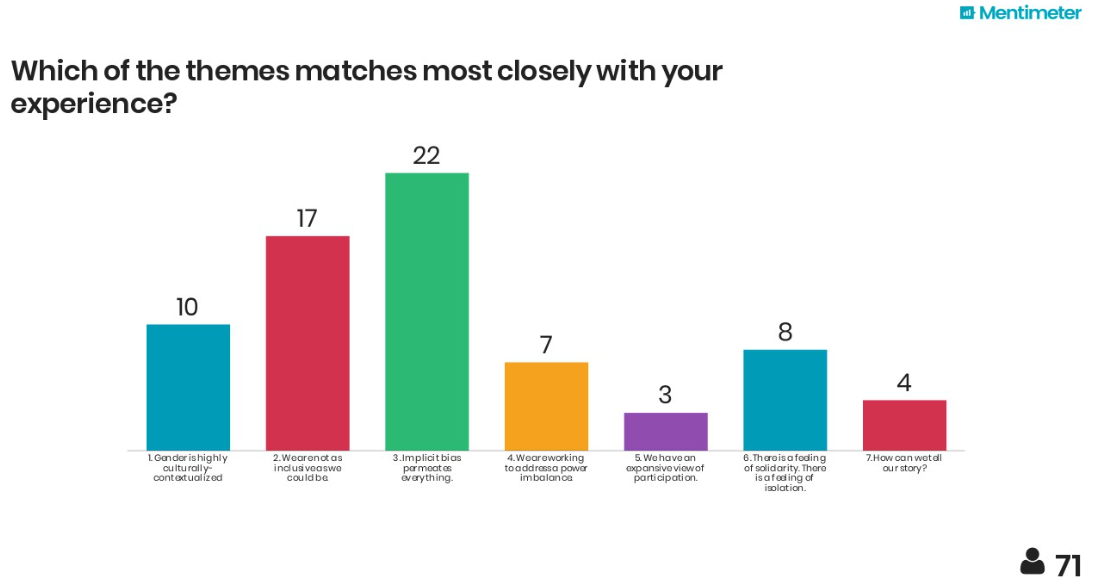
The image shows a screen with a bar chart and text that reads "Which of the themes matches most closely with your experience?".
Read full description
The image shows a screen with a bar chart and text that reads "Which of the themes matches most closely with your experience?". The chart is divided into four sections, each with a different color, and each section is labeled with a number. The colors range from light blue to dark blue, and the text is written in a bold, black font.