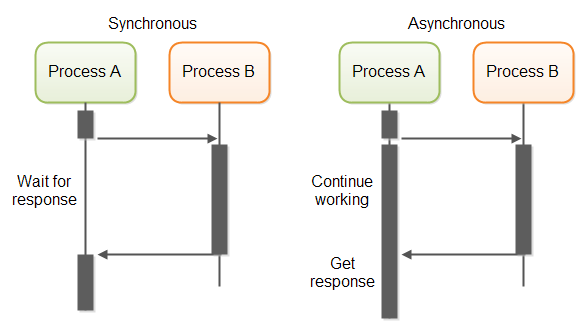
The image shows a flowchart diagram depicting the process of synchronous and asynchronous processes.
Read full description
The image shows a flowchart diagram depicting the process of synchronous and asynchronous processes. It is a visual representation of the steps involved in the process, with each step represented by a box and arrows connecting them. The boxes contain text describing the various steps, such as "Process A," "Process B," and "Process C," and the arrows indicate the direction of the flow of the process. The diagram also includes a legend at the bottom that explains the meaning of each step.