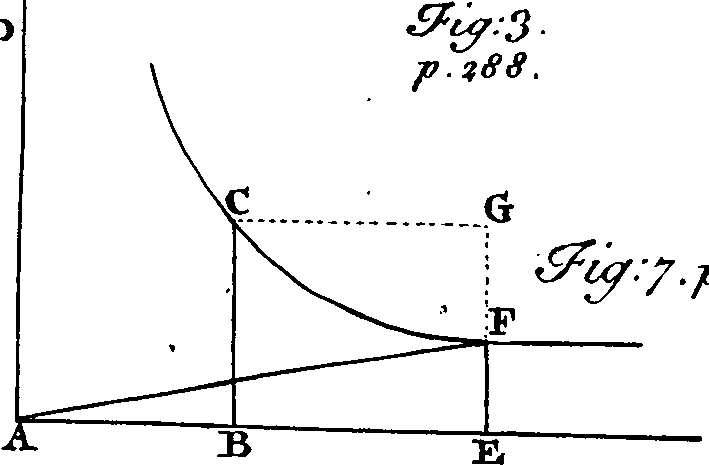
The image shows a graph of the demand curve for a product, with a white background and black text written on it.
Read full description
The image shows a graph of the demand curve for a product, with a white background and black text written on it. The graph illustrates the relationship between the two variables, with the x-axis representing the demand and the y-axis indicating the price of the product.