← Image collections
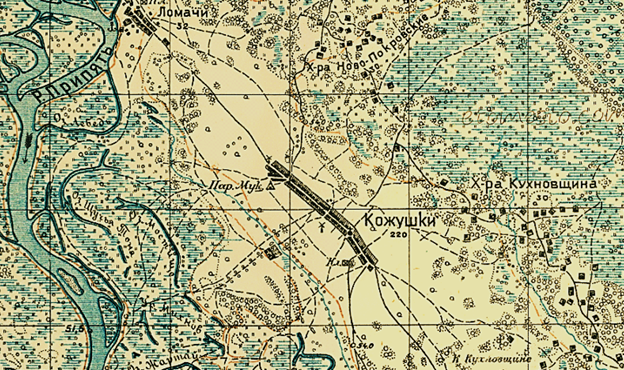
The image shows an old topographic map of the city of Kiev, Ukraine, with text and numbers indicating the extent of the Russian Empire. It is a detailed map, showing the streets, buildings, and other features of the area.

More from PD12M

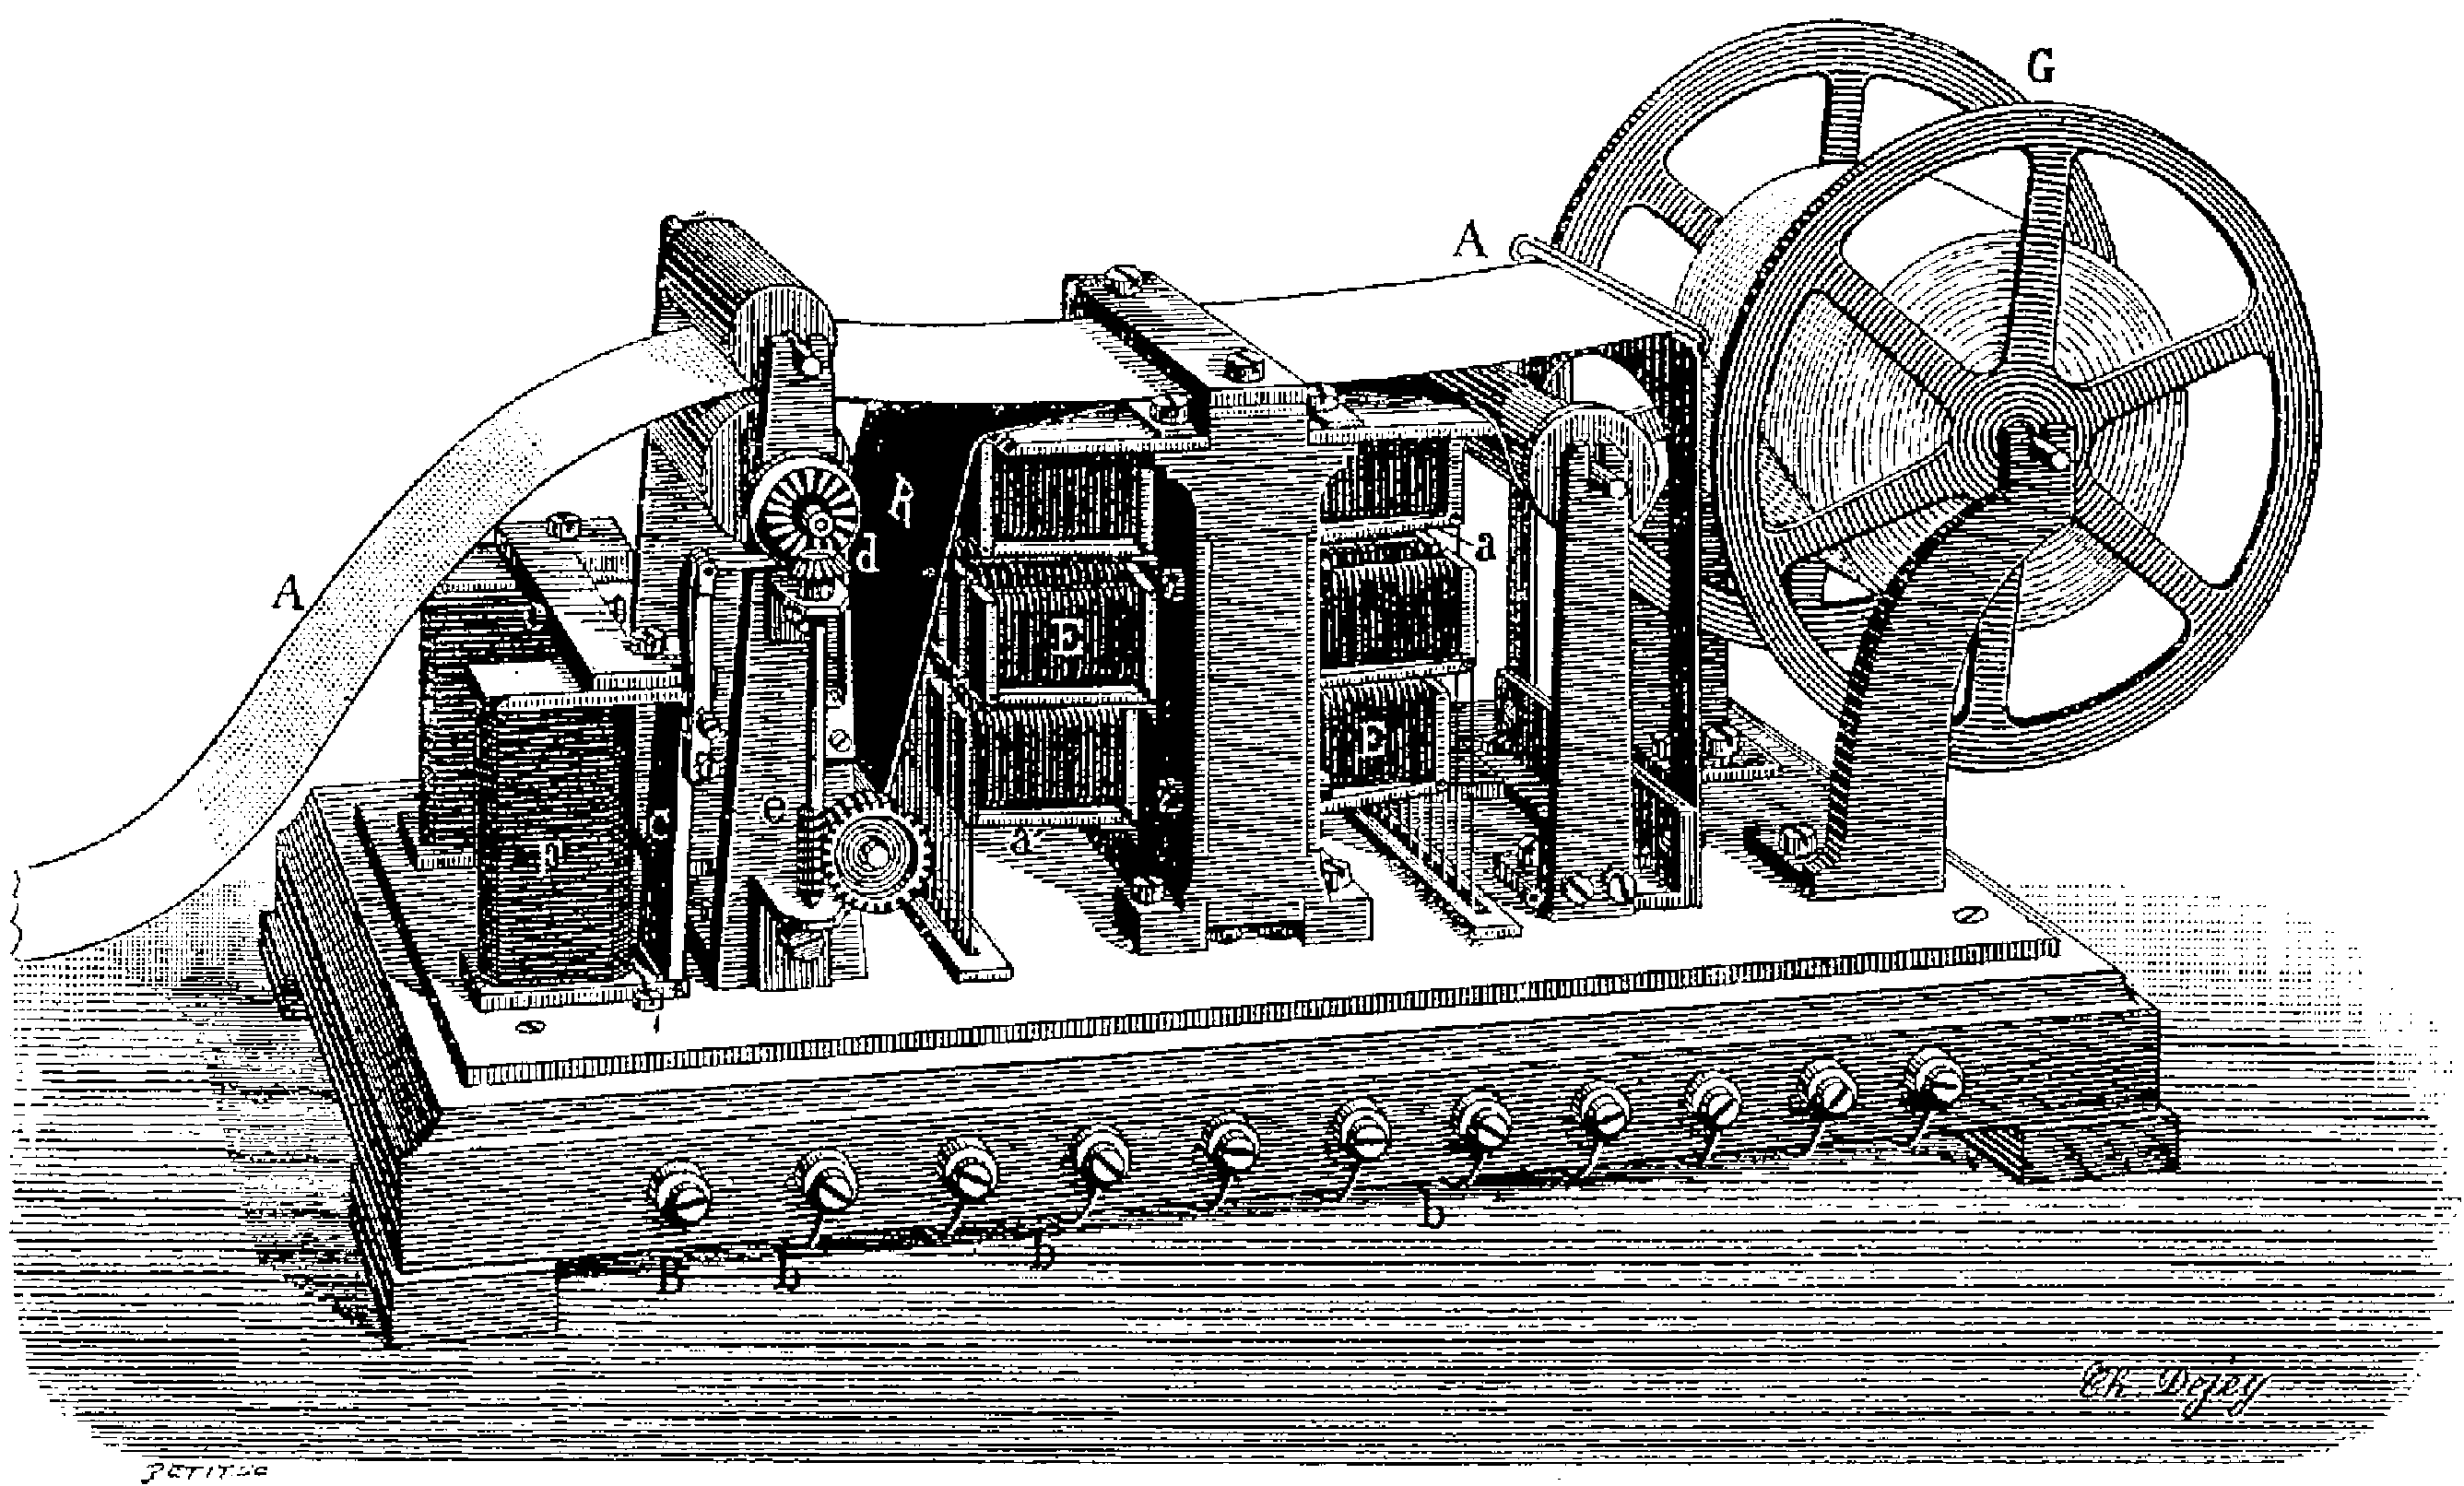
The image shows a black and white drawing of a machine with a wheel, which appears to be a telegraph. The machine has a cylindrical shape with a handle on the side and a spool of wire extending from the top. The wheel is connected to the machine and has several spokes radiating out from it. The text written on the image reads "Telegraph".
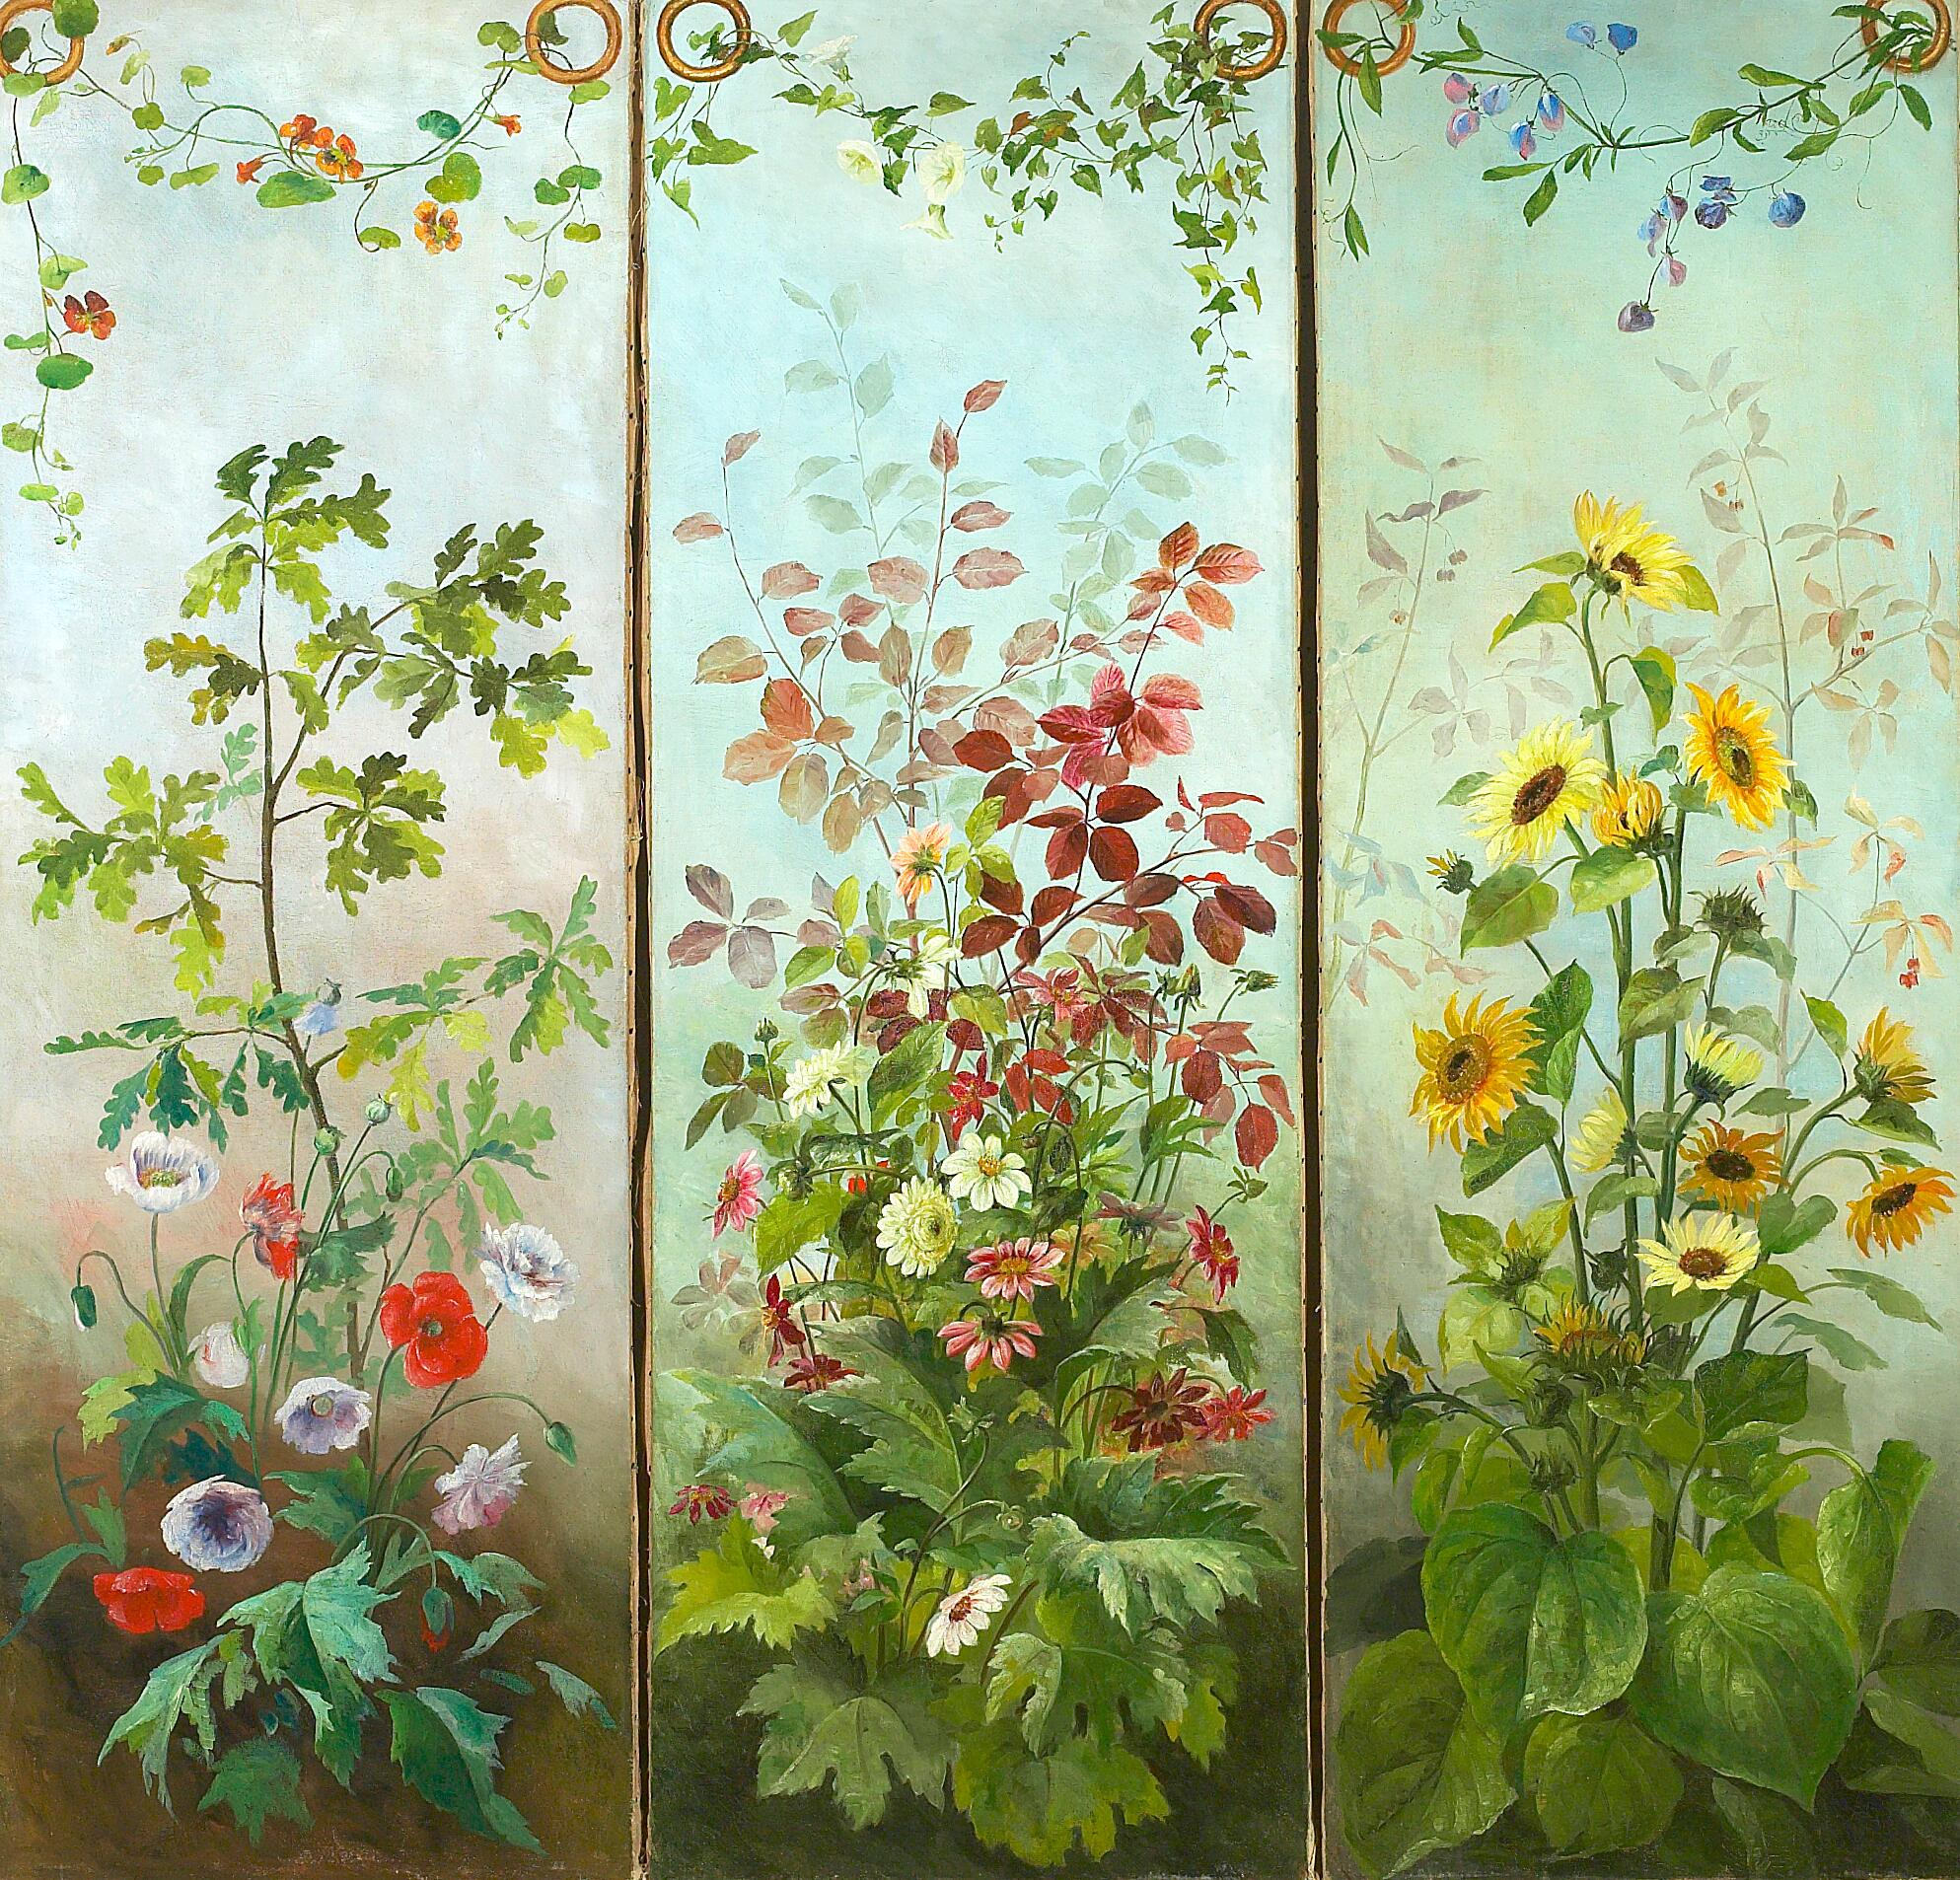
The image shows a painting of three panels with sunflowers and other flowers painted on them. The painting is composed of vibrant colors and intricate details, depicting the plants and flowers in great detail.
The image shows a black and white photo of a man with a mustache wearing a suit. He has a serious expression on his face and his hair is neatly combed. His eyes are focused and his lips are slightly parted, giving him a thoughtful and contemplative look.
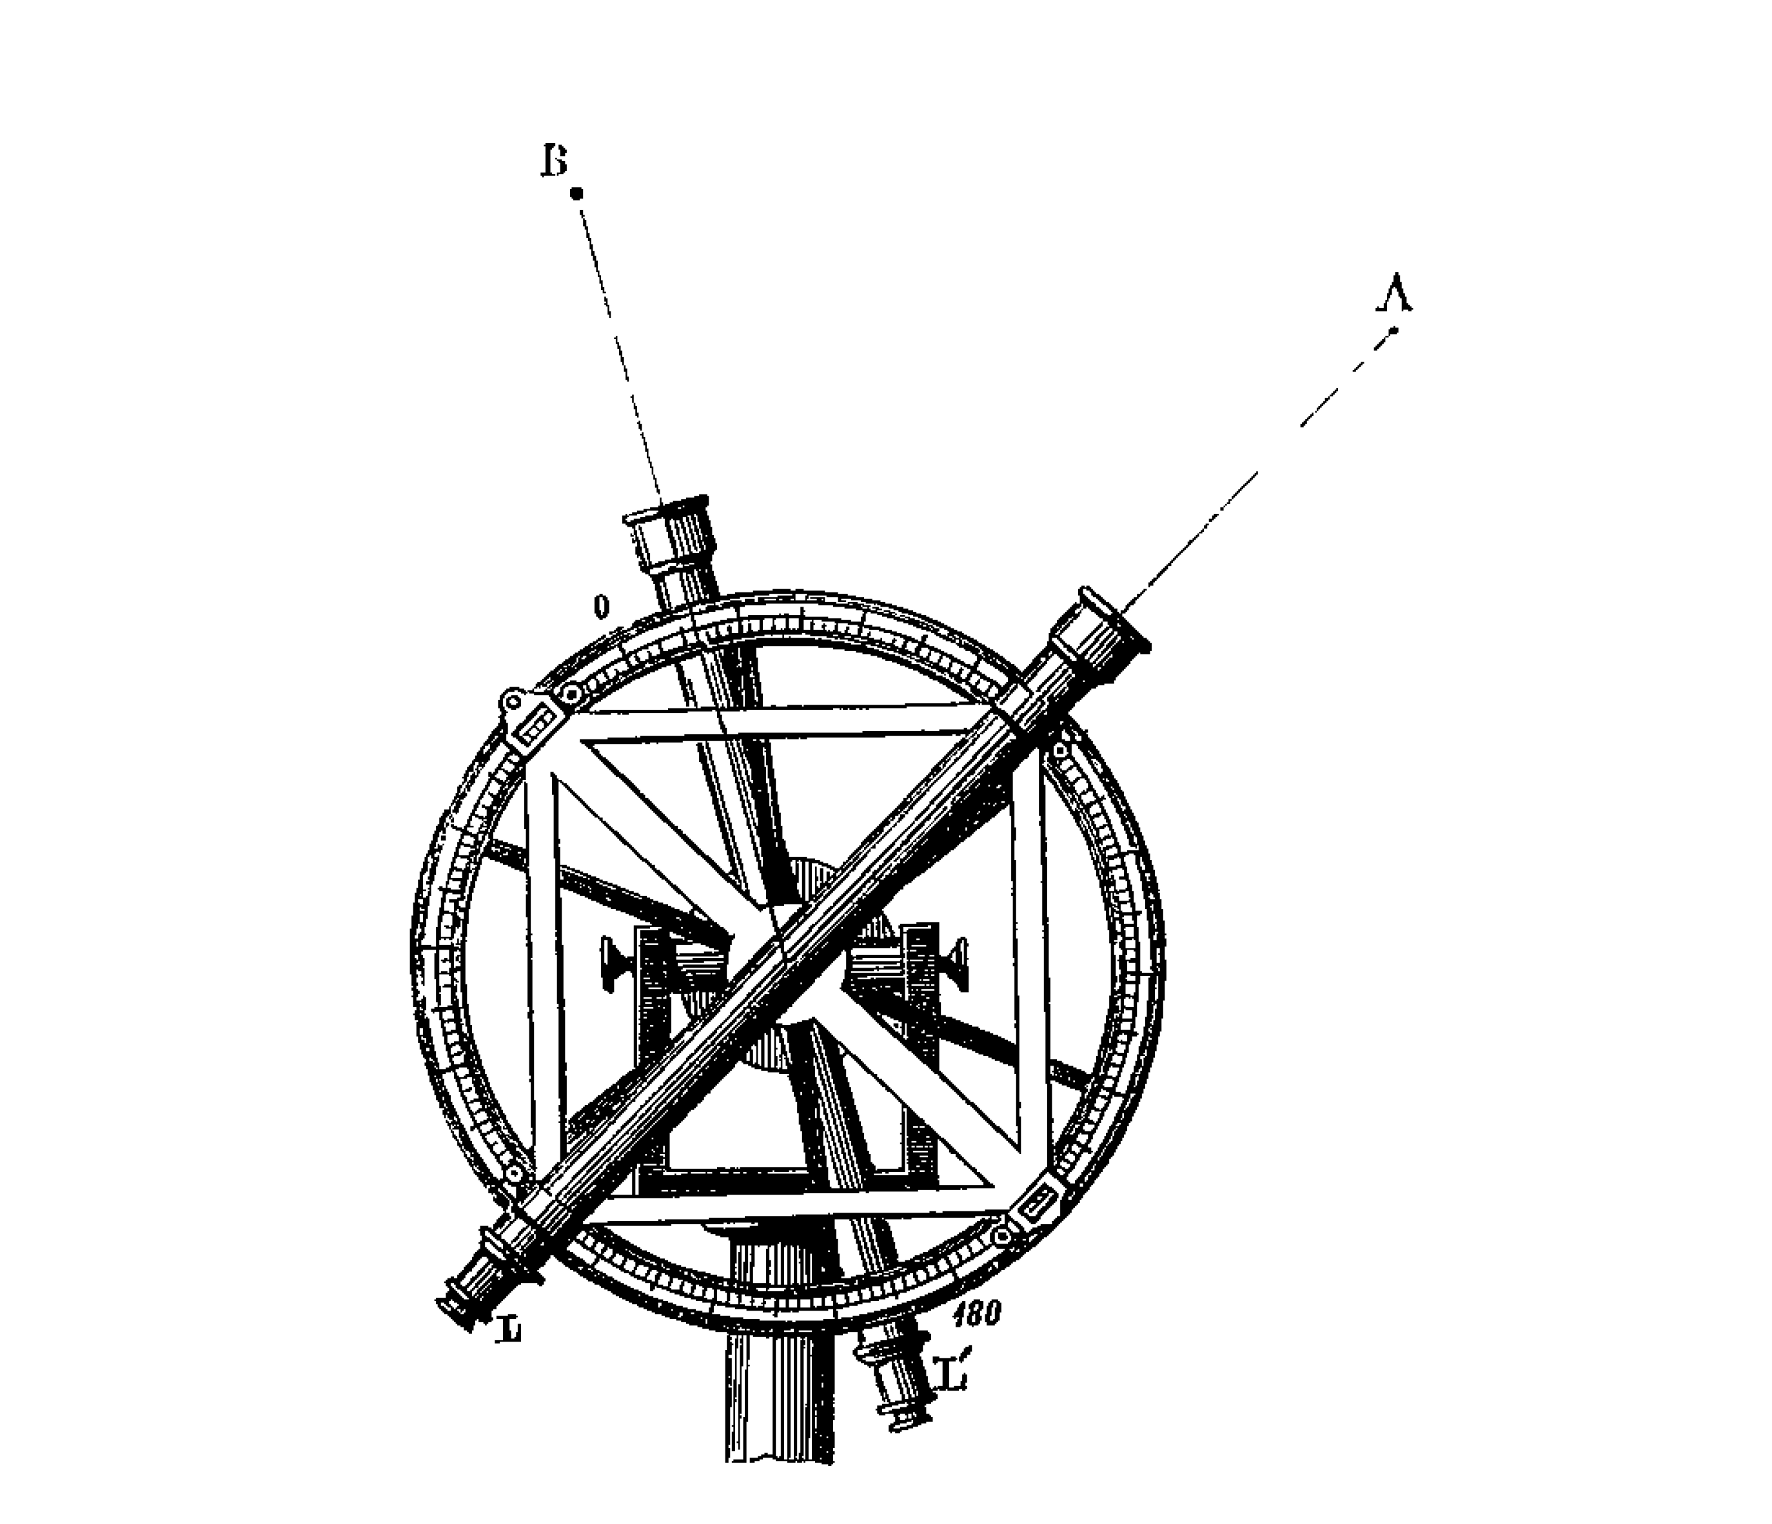
The image shows a black and white drawing of a wheel with a telescope attached to it, set against a white background. The telescope is a sextant, which is a device used to measure the distance between two objects.
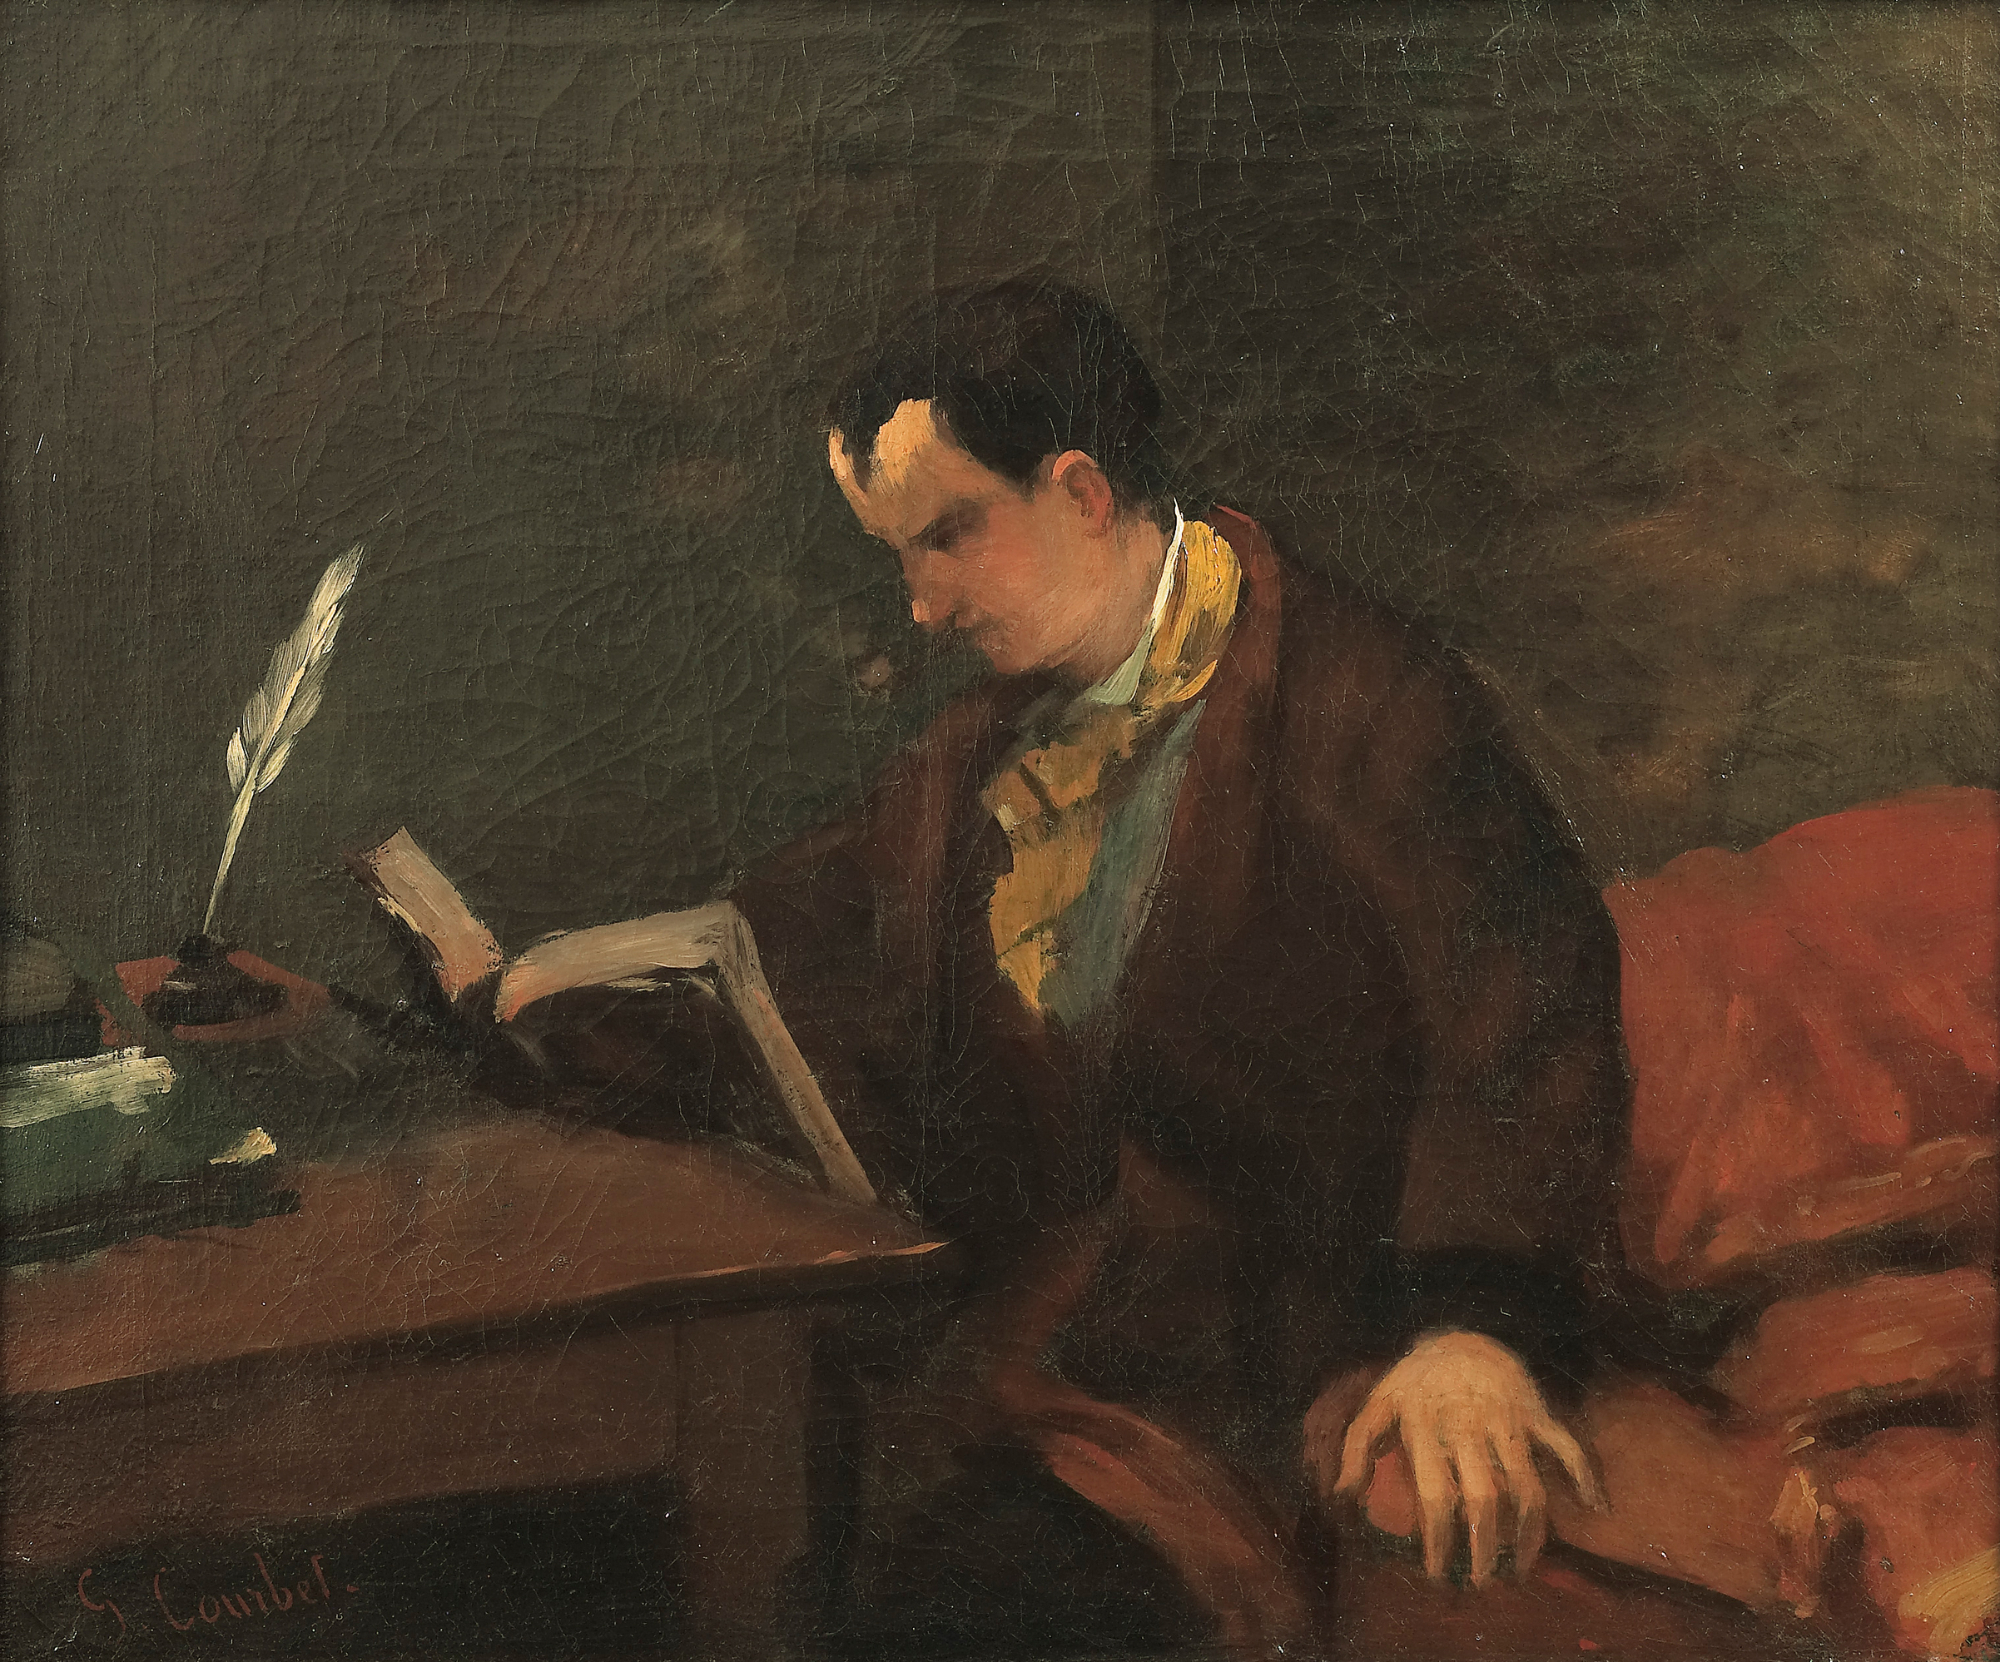
The image shows a man sitting at a table, engrossed in a book he is holding in his hands. On the table in front of him are a few books and a feather quill pen, suggesting he is in the middle of writing.
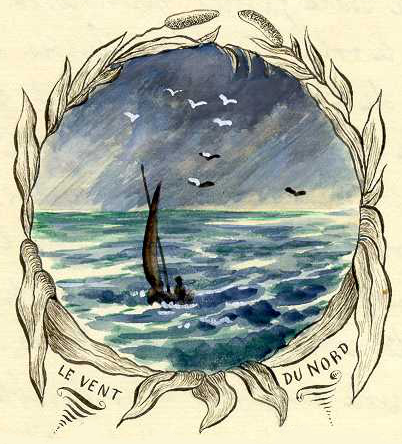
The image shows a painting of a sailboat in the ocean with birds flying around it. The boat is surrounded by a vast expanse of blue water and the sky is filled with white, fluffy clouds. At the bottom of the painting, there is some text written in a cursive font.
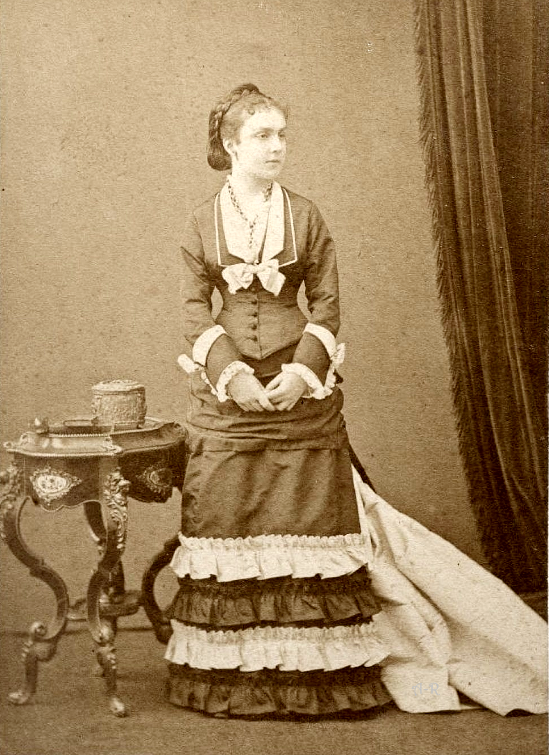
The image shows an old photo of a woman in a dress standing on the floor with a table in front of her. On the table there is an object, and in the background there is a wall and a curtain.
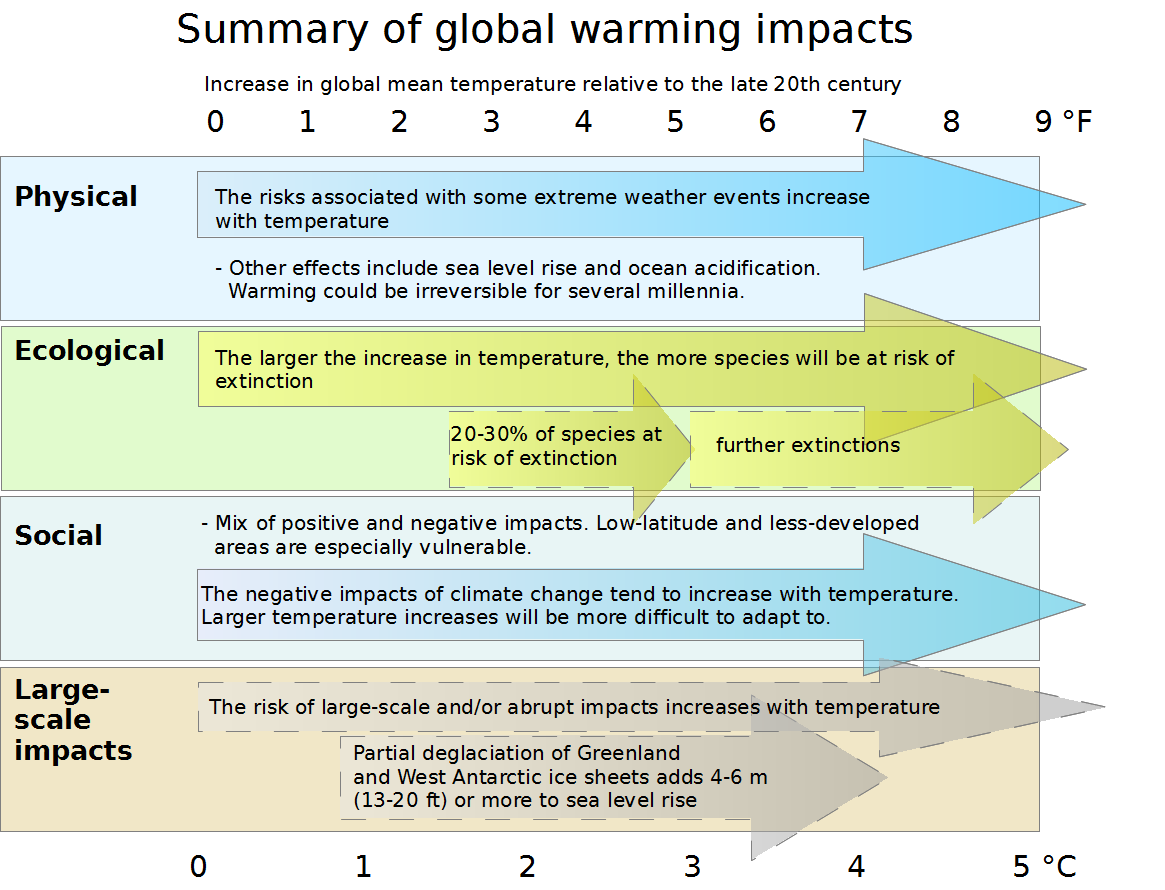
The image shows a chart with text and arrows that illustrate the global warming impacts. The chart is divided into sections, each with a different color and label, and each section is further divided into subsections that explain the different types of global warming and how they affect the environment. The colors range from light blue to dark blue, with the darker blue representing higher temperatures and the lighter blue representing lower temperatures. The labels on the chart provide further information about the impacts, such as the number of people affected by each type of climate change, the amount of precipitation, and the average temperature.
Explore collections