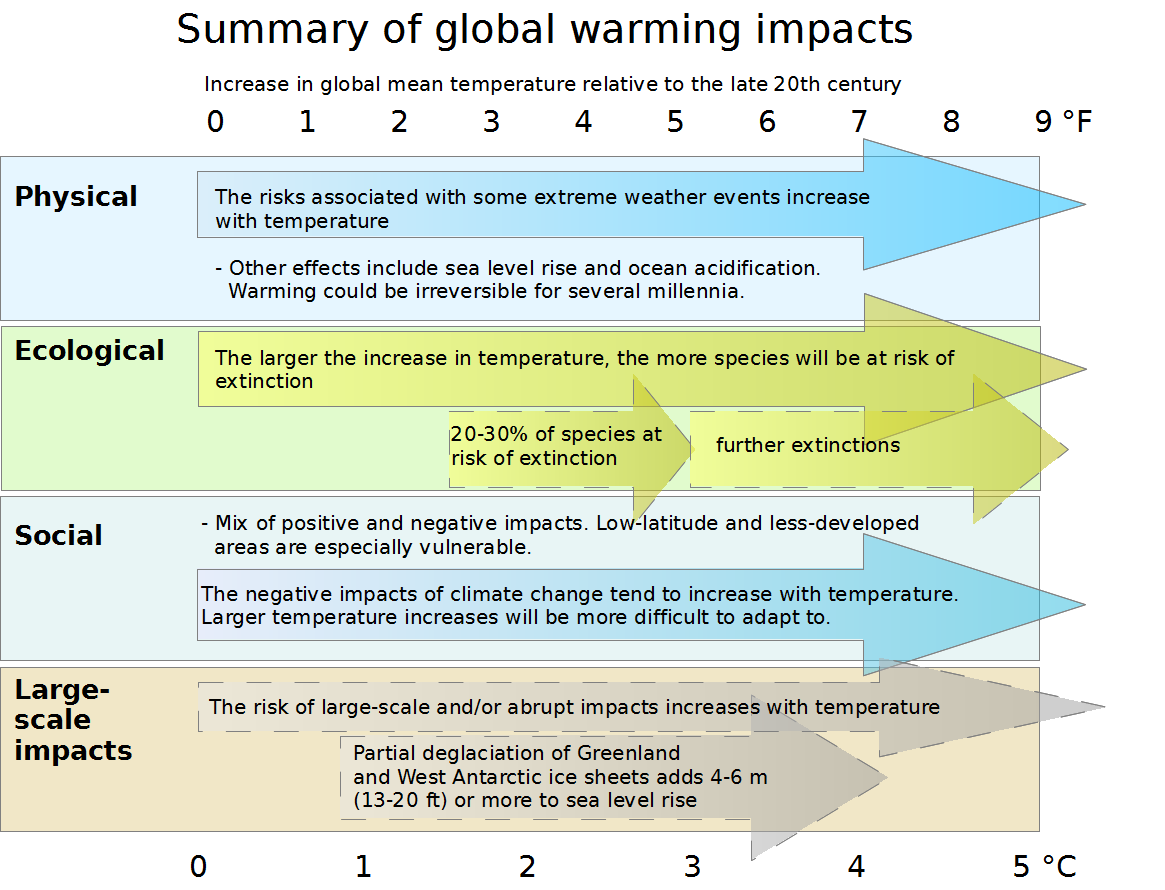
The image shows a chart with text and arrows that illustrate the global warming impacts.
Read full description
The image shows a chart with text and arrows that illustrate the global warming impacts. The chart is divided into sections, each with a different color and label, and each section is further divided into subsections that explain the different types of global warming and how they affect the environment. The colors range from light blue to dark blue, with the darker blue representing higher temperatures and the lighter blue representing lower temperatures. The labels on the chart provide further information about the impacts, such as the number of people affected by each type of climate change, the amount of precipitation, and the average temperature.